Here’s what’s happening with COVID-19 cases in Whatcom schools; county’s numbers
For the first time since the height of the omicron surge in mid-January, Whatcom County schools saw a weekly increase in COVID-19 cases during the final full week of March, though it was just a slight uptick.
The Bellingham, Ferndale, Lynden, Meridian, Mount Baker and Nooksack Valley School districts reported 1.7 new COVID-19 cases (33 total cases) per 1,000 students during the week of March 20-26, The Bellingham Herald’s analysis of district COVID dashboards found. The Blaine School District did not update its COVID dashboard to reflect any cases that week.
The rate was up from 1.2 cases per 1,000 students reported from a week earlier.
Cases in schools peaked the week of Jan. 16-22, when there 49.0 cases per 1,000 students, but since then and until the last full week of March that rate has steadily decreased.
Since returning from winter break, the seven districts have reported a total of 3,343 cases, or a weekly rate of approximately 12.7 cases per 1,000 students.
The COVID-19 dashboards on Whatcom County school district websites showed:
▪ Bellingham Public Schools has reported 951 total COVID-19 cases in its schools since winter break, or a weekly rate of 13.3 cases per 1,000 students, according to The Herald’s analysis. The district reported 12 cases the week of March 20-26, which was unchanged from the week before.
▪ Blaine School District has reported 548 total COVID-19 cases in its schools since winter break, or a weekly rate of 21.4 cases per 1,000 students, according to The Herald’s analysis. The district reported district did not update its dashboard for the week of March 20-26.
▪ Lynden School District has reported 400 total COVID-19 cases in its schools since winter break, or a weekly rate of 10.0 cases per 1,000 students, according to The Herald’s analysis. The district reported two case the week of March 20-26, which was one fewer than the week before.
▪ Meridian School District has reported 360 COVID-19 cases in its schools since winter break, or a weekly rate of 16.4 cases per 1,000 students, according to The Herald’s analysis. The district reported six cases the week of March 20-26, which was five more than the week before.
▪ Mount Baker School District has reported 297 COVID-19 cases in its schools since winter break, or a weekly rate of 13.3 cases per 1,000 students, according to The Herald’s analysis. The district reported one case the week of March 20-26, which was one fewer than the week before.
▪ Nooksack Valley School District has reported 349 cases in its schools since winter break, or a weekly rate of 14.7 cases per 1,000 students, according to The Herald’s analysis. The district reported three cases the week of March 20-26, which was two fewer than the week before.
▪ Ferndale School District reported Thursday, March 31, that 12 students or staff had positive COVID-19 tests reported to the Whatcom County Health Department, which was up from 11 reported March 25.
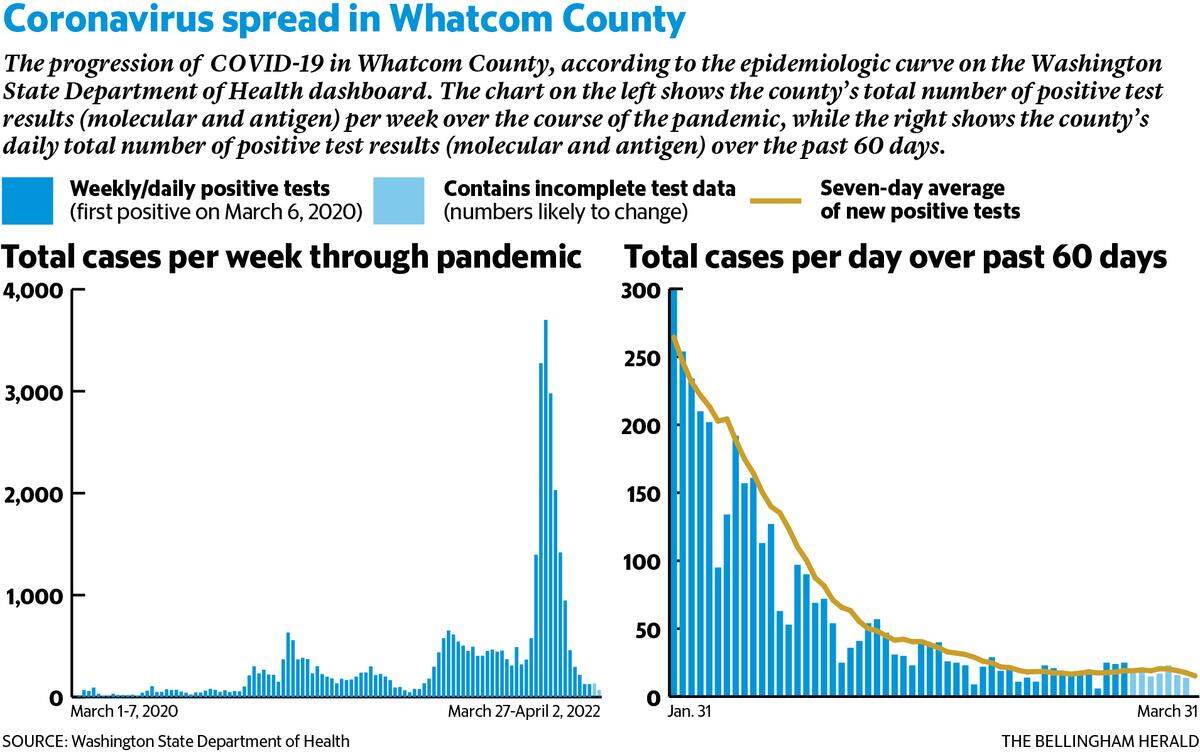
Whatcom’s latest COVID numbers
Whatcom County saw 35 new total (confirmed and probable combined) COVID-19 cases reported on the Washington State Department of Health COVID-19 Data Dashboard Friday, upping its total of new cases to 128, which was 49 fewer than the week before. Through the pandemic, Whatcom County has had 37,226 total cases.
St. Joseph hospital in Bellingham, meanwhile, reported it was treating five patients for COVID-related symptoms on Monday, April 4, after seeing counts of six on Saturday, April 2, and three on Sunday, April 3. Over the past seven days, the hospital’s daily snapshot has shown an average of 5.7 COVID-related patients per day, which represents 2.3% of the hospital’s 252 inpatient beds and is down from an average of 6.0 patients a week earlier.
The latest report on the state dashboard, which is updated on Monday, Wednesday and Friday evenings, shows Whatcom County has:
▪ 32,699 confirmed cases during the pandemic — up 35 from the last report. Whatcom saw a total of 112 new confirmed cases reported last week, which was down from the 161 reported the week before.
▪ 4,527 additional probable COVID cases during the pandemic — unchanged from the last report — resulting from positive antigen tests not confirmed by a molecular test. Whatcom saw a total of 16 new probable cases reported last week, which was unchanged from the week before.
▪ A weekly infection rate of 59 cases per 100,000 residents for the most recently completed epidemiological data March 17-23 — up from 53 one week earlier (March 10-16).
▪ 1,522 COVID-related hospitalizations during the pandemic — up three from the last report. Whatcom saw five new hospitalizations reported last week, which was down from 21 the week before.
▪ A weekly COVID-related hospitalization rate of 2.2 patients per 100,000 residents for the most recently completed epidemiological hospitalization data March 17-23 — down from 4.4 from a week earlier (March 10-16).
▪ 290 COVID-related deaths during the pandemic — unchanged from the last report. Whatcom saw one death reported last week, which was down from the two reported a week earlier.
▪ 5,934 tests (molecular and antigen combined) completed during the most recently completed epidemiological data March 16-22, with 2.2% of the tests returning a positive result. A week earlier (March 9-15) the state reported 5,685 tests completed and 2.2% returning positive results. The state’s data does not include at-home rapid tests that were not reported.
▪ 371,567 vaccinations administered during the pandemic — up 330 from the last report. A total of 858 administered doses were reported in Whatcom County last week, up from 762 the week before. The state reports 74.8% of Whatcom County’s total population has initiated vaccination and 68.4% has completed it.
▪ 87,632 booster vaccine doses administered, meaning 61.1% of Whatcom’s residents eligible to receive a booster dose have done so.